Quarter 12 update – November 2016

During this quarter our research efforts have been focused on four areas:

  1. Eliciting user needs for a Formula Student team project health monitoring dashboard and consolidation / grouping of analytical techniques (proxies) to meet FS user needs.
  2. Preparing industry-facing summaries of the proxies that we have developed.
  3. Creating a real-time skills and competency mapping dashboard with one of our industrial partners.
  4. The preparation of a joint research proposal with another of our industrial partners to exploit the findings and techniques developed in this project.

Formula Student Dashboards

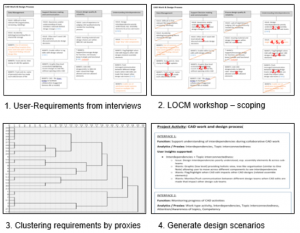
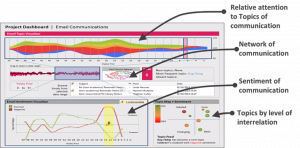
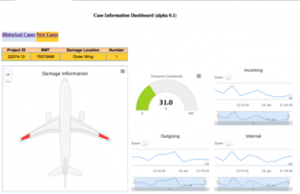
On the first point, in order to understand how the Formula Student team could benefit from our project’s techniques, a series of user-interviews were conducted. Academic staff supervisors and student project managers from Universities of Bath, Bristol and UWE took part in semi-structured interviews. Interviews were coded using thematic analysis, which identified 85 unique user requirements. Further axial coding and affinity diagramming showed user insights focused on four core areas of activity within the project: 1) planning and monitoring project progress, 2) CAD based design process, 3) communication and team dynamics, and 4) team competencies.

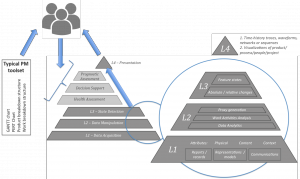
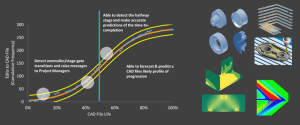
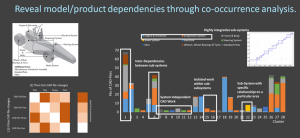
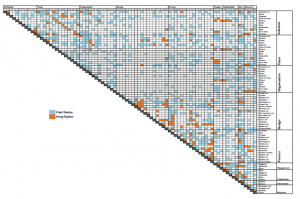
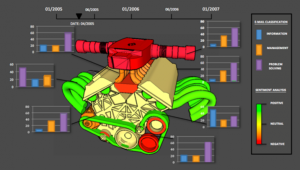
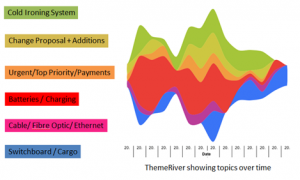
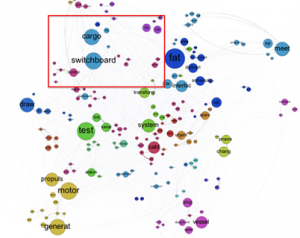
For each requirement, we discussed and agreed which were outside the scope of project management support and, in line with wider project aims, were not automatable. For the remaining 36 unique in-scope requirements, researchers tagged each with one or more of the nine developed proxies that could be applied to support that user-requirement. A hierarchical cluster analysis method was used to group user insights that could be addressed by similar sets of analytics/proxies. The outcome of this analysis was the generation 10 design scenarios. These design scenarios provide narrative descriptions which envision how users may interact with a dashboard. They both enable researchers to anchor envisioned proxy applications to the users’ requirements, work practices and context; and also provided a clear and simple means to support communication with users in the evaluation and the iterative design process of creating dashboards tailored to support Formula Student:

fs


Quarter 11 update – July 2016

Research effort has been primarily focused on three areas this quarter to July: presentation of conference papers, development of the framing of the research with respect to engineering Project Health Monitoring (ePHM), and holding industrial workshops.

Conferences

For the first, we’re delighted to say we’ve picked up not one, but two awards for outstanding contributions to Design ’16 and Design Computing and Cognition ’16. Check out our Publications page for more details.

Framing our Work

Secondly, following an ongoing and extensive period of framing and re-framing, the underlying constructs and methods created as part of the project, we have converged on a model of engineering Project Health Monitoring (ePHM). This model is a contextualisation and extension of the accepted model of IVHM (Intelligent Vehicle Health Monitoring):

ePHM


Workshops

In the Q10 report we summarised the design and format of our user-drive workshop. In particular, the workshops last 2.5-3hrs and involve three stages. The first stage is a general discussion and brainstorm of the factors that impact the performance of engineering projects. The second stage involves that ranking of the relative importance of the set of project feature that we have developed. Further, participants are asked to rate the level of understanding of these features afforded by their current tool set. The third stage is an interactive design sessions. Here the aim is for participants to individually then collaboratively develop concepts for supportive dashboards for engineering projects:

workbook

To date we have held three workshops: The first was with the Strategic Project Office of the University of Bristol, the second was with Frazer Nash Consultancy, and the third was held in Croatia with a mix of participants from industry and academia. Over 70 people have participated to date. We are planning further workshops with with an industrial partner in August and Formula Student teams later in the year.

Quarter 10 update – April 2016

The focus over this period has been two-fold: The first has dealt with consolidating the various analyses associated with each case study (data set) while the second has been to develop our approach for capturing user requirements and context(s). In the former work has continued across the four case studies associated with a Formula Student team and our other industrial partners.  For the latter we have developed a combined survey and interactive workshop for potential users.

During this quarter four conference papers have been accepted for publication and are to be presented in Croatia in May and Chicago in June. In addition to this a journal article associated with the automated typing of topics in email associated with engineering projects has been submitted to the Journal of Advanced Engineering Informatics.

In addition to preparing the data set and planning analysis, Dr Emanuel has been interviewing the project manager on a monthly basis to understand the issues faced and user needs, with the aim of distilling a set of requirements for an FS dashboard. Interviews and analyses are ongoing, with two main focuses. First, requirements extraction will centre on supporting the project manager’s work flow, decision making capabilities and needs regarding issue/problem support across the 22 week build period. Second, the interviews will be used to understand the prevalence or importance of the project features, developed by Dr Snider, at different points in the build life cycle. Dr Emanuel has used the previous year’s CAD model as boundary object to communicate where work and issues are occurring as they develop this year’s car. The aim is to match these annotations to occurrences in CAD activity:

FS_car_annotated


We’ve also been undertaking lots of other work in collaboration with our industrial partners, such as a tool that predicts project complexity and duration with over 75% accuracy after the project is around 30% completed.  Another tool we have developed automatically connects and visualises people, topics and reports.  This is being used initially as a tool to map and identify competencies, but we hope to expand it into a tool to support the creation of technology road maps also – watch this space!

Finally, we were delighted to host Dr Heli Aramo-Immonen from Tampere University of Technology. Dr Aramo-Immonen is collaborating with Dr Joel-Edgar on visualisations to support knowledge management.

Quarter 9 – Jan 2016 update

In this period we have been verifying and validating the various analytical methods and began research to understand user contexts in order that we can begin to research dashboard concepts.  Work in the area of analysis of representations has led to models to predict time to completion and stability of CAD models.  For example, we can accurately predict time to completion when the model is only about 50% complete:

Q9-Jan-2016

Through this work we have partnered the National Composite Centre (NCC) to explore transfer-ability of the techniques to Finite Element Analysis (FEA). Work with the NCC is also exploring the automatic mapping of capability and competencies.


Quarter 8 – November 2015 update

In this quarter we have demonstrated analytical approaches for revealing previously hidden product and process dependencies through analysis of User-CAD interaction and content of technical reports/communications and novel methods for monitoring and predicting likely project complexity for routine projects.

For example, we’ve been using co-occurrence analysis to reveal model product dependencies.  However, unlike traditional methods, we can also include data from representations such as CAD models:

Q8-November-2015


Quarter 6 – April 2015 update

Over the last quarter we have been consolidating our analysis, with the aim of grouping analyses into prototype dashboards for communications, records and representations (such as CAD). Further work has been completed to finalise the full range of project features associated with the concept of engineering project health monitoring. We have now identified 85 features (proxies) for engineering Project Health Monitoring (ePHM) and started work on validating these, and ranking their relative importance for engineering project health.

Due to the number of features, this is proving quite a time consuming task – here is a small sample of the matrix!

Q6-April-2015

Quarter 5 – January 2015 update

The major focus of our research effort has been on the acquisition of further datasets, preparation of prototype dashboards (vision demonstrators) and preparation of conference papers.

For example, here is a new composite of various analyses:

Q5-Jan-2015

We’re also pleased to report that a total of five conference papers were accepted for presentation at the prestigious International Conference on Engineering Design (http://iced2015.org/), to be held in Milan in July. Details of these papers may be found in our publications section. We are also pleased to announce that RWA have now joined the project.

Quarter 4 – October 2014 update

Following the Project Advisory Group meeting of our industrial partners in the summer, and further feedback from industrial partners, the focus of research has been on the following areas: the configuration of prototype project dashboards and the development of the concept of engineering project health monitoring, and in particular, the proxies of performance of engineering projects – i.e. features of interest for project stakeholders. To address the latter a series of ethnographic studies are to be undertaken.

Below are some examples of composites of various analyses we are now able to undertake.  Here we are mapping sentiment and type of email being sent onto a representation of a product – who is saying what about each part of the product?  This could give project managers valuable early warning about potential issues:

Q4-October-2014-1

Similarly, this example dashboard shows various information about aircraft repairs, using a visual representation of the aircraft and damage location:

Q4-October-2014-2

Quarter 2 – March 2014 update

Based on a review of extant research combined with scoping of datasets digital assets are to be split into three types (communications, records and representations) and four classes of attribute (physical, content, context, and semantic). A series of scoping studies are being undertaken around communication in a large systems engineering project, the digital assets associated with a Formula Student project and the workflow of an in-service repair and maintenance department.

We’ve also begun exploring visualisations of the outputs – here is a ‘theme river’ showing how various key topics from a project wax and wane over the lifetime of a project – all extracted automatically:

Q2-March-2014

And here is an example of an automatic analysis of how terms used in a project are related to each other – this could be used to help uncover hidden dependencies, for example:

Q2-March-2014-2

Quarter 1 2013 update

Since the project kick-off meeting in September the project team has focused on four interrelated areas. These are: understanding extant research, developing a data management plan, initial exploratory studies, and developing analytic capability including the use, modification and creation of tools (code) and associated methods, such as semantic analysis.

For example, this graph shows the evolution of various types of digital object over the life of a project.  It looks pretty, but what we can tell from this? Does a ‘good’ project and a ‘bad’ project look the same?

Q1-2013